
4/25/2012 — Radiation Monitoring Links
DUTCHSINSE = SINCEDUTCH
April 25, 2012

list of radiation monitoring links:
USA and global coverage:
http://www.radiationnetwork.com/
http://www.blackcatsystems.com/RadMap/map.html
German Radiation Protection Agency:
http://strahlenbelastung.wo-wann-wer.de/
http://www.bfs.de/en/ion/imis/spurenmessungen.html
http://www.eurad.uni-koeln.de/
********************
all old links below
dutch radiation monitoring:
http://www.rivm.nl/milieuportaal/dossier/meetnetten/radioactiviteit/resultaten/
swiss radiation monitoring:
https://www.naz.ch/en/aktuell/zeitverlaeufe.html
Finland radiation monitoring:
http://www.yle.fi/tekstitv/html/P160_01.html
http://www.stuk.fi/index_en.html
http://www.yle.fi/tekstitv/html/P867_02.html
French radiation monitoring:
http://sws.irsn.fr/sws/mesure/index
http://www.irsn.fr/FR/Documents/france.htm
http://www.irsn.fr/EN/Pages/home.aspx
Japan radiation monitoring:
http://www.jaif.or.jp/english/
http://www.mext.go.jp/english/radioactivity_level/detail/1303962.htm
http://www.nisa.meti.go.jp/english/index.html
http://www.mapion.co.jp/topics/genpatu/
Norway radiation data:
http://transport.nilu.no/products/fukushima?searchterm=fuk
————————————————
jet stream forecasting:
http://squall.sfsu.edu/crws/jetstream.html
http://arctic.atmos.uiuc.edu/CT/animate.arctic.color.0.html
http://www.srh.noaa.gov/srh/tropicalwx/satpix/nwpac_ir4_loop.php
http://www.stormsurfing.com/cgi/display_alt.cgi?a=glob_250
–
Other radiation and nuclear power based links:
http://eurdeppub.jrc.it/eurdeppub/home.aspx#
http://www.epa.gov/japan2011/rert/radnet-data-map.html
http://www.nucleartourist.com/
———————————————-


Converting From CPM to mR/hr
http://www.antirad.com/units.htm
Simple conversion from µR to µSv. You divide µR by 100 to get µSv.
Example: The Model 500VBR displays 123456 µR is the same as 1234.56 µSv.
The curie is the number of particles per second from 1 gram of Radium = 3.7 x 10 E10 counts/second = 37 billion cps. = 37 billion Becquerel.
1 Becquerel (Bq) = 1 count per second = 1 event per second
1 microcurie = 1 uCi = 37,000 Bq = 37,000 cps.
1 microcurie = 2.22 x 10E6 disintegrations / minute = 2,220,000 cpm.
1 nanocurie = 1 billionth of a curie = 2,220 disintegrations / minute.
1 picocurie = 2.2 disintegrations / min.
Dosage units:
Gray (Gy) = 1 Joule/kg
Sievert (Sv) = Gray x QF, where QF is a “quality factor” based on the type of particle.
QF for electrons, positrons, and xrays = 1 QF = 3 to 10 for neutrons, protons dependent upon the energy transferred by these heavier particles.
QF = 20 for alpha particles and fission fragments.
The Sievert is a measure of biological effect.
Converting older units:
1 rad = 1 centigray = 10 milligrays ( 1 rad = 1cGy = 10 mGy )
1 rem = 1 centisievert = 10 millisieverts ( 1 rem = 1cSv = 10 mSv )
1 mrad = 10 uGy
Nominal background radiation absorbed dose of 100 mrad/year = 1 mGy/yr.
Nominal background radiation dose biological equivalent of 100mrem/year = 1mSv/yr.
Occupational whole body limit is 5 rem/yr = 50 mSv/yr. ( Recently proposed that levels be reduced to 2 rem/yr.)
2.5 mrem/hr or 25 uSv/hr is maximum average working level in industry.
Exposure rate from Naturally Occurring Radioactive Material (NORM) ; an empirically derived conversion factor for Ra-226 decay series: 1.82 microR/ hour = 1 picoCurie/gram.
Conversion chart for CPM to mSv/h is here:
http://www.antirad.com/units.htm
http://unit-converter.org/en/equivalent_dose/mSv.html
http://www.blackcatsystems.com/GM/converting_CPM_mRhr.html
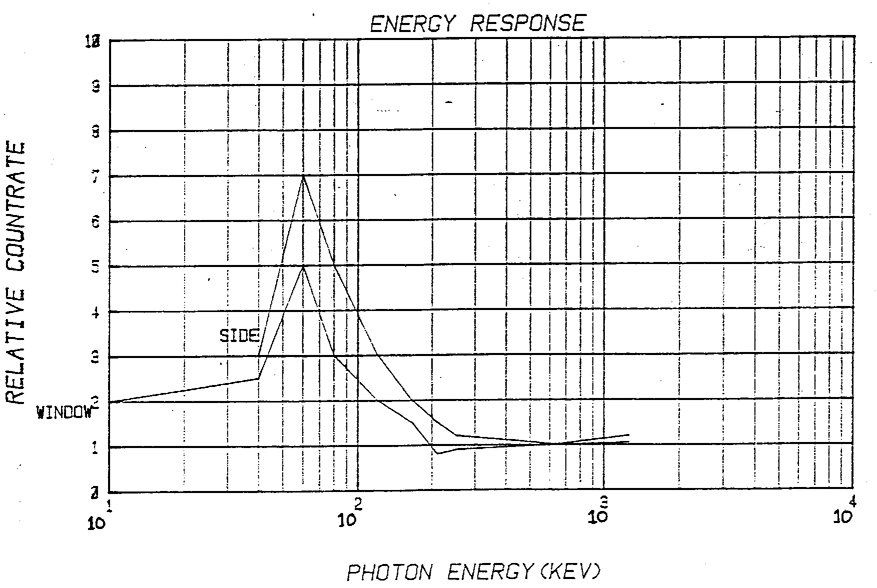
There is a graph available showing the relative sensitivity for other gamma energies.
This page briefly describes the various units of radiation
Background Radiation Levels
  Source                   millirems

  Natural
   Radon                   200
   Other than Radon:       100
    Cosmic           27
    Terrestrial      28
    Internal         39
   Total                   300

  Nuclear Fuel Cycle       0.05
  Consumer Products*       10

  Medical
  Diagnostic X-rays        39
  Nuclear Medicine         14
   Total                   53

  Total   about 360 mrems/year

  *Includes building material, television receivers, luminous watches,
smoke detectors, etc.

Source: National Council on Radiation Protection and Measurement (NCRP
93)
There is a nice graph from the University of Michigan.


Leave a comment